
Introduction
As a Philadelphia resident, the quality of the air I breathe has become an increasingly crucial issue. Not only do the major highways that pass through residential areas cause an decrease in air quality, but many stakeholders in the city have lobbied for investment into the Philadelphia Energy Solutions (PES) refining facilities in our southern region, despite their lack of financial stability (Jaramillo, 2018). Most recently, there was a proposal for a renewable energy plant in the same development that arguably wouldn’t produce significantly more air pollution, but would allow for PES to acquire more stability and keep operating at the same level of pollution as they have been in the past (Jaramillo, 2018).
Other proposed plants, such as SEPTA’s natural gas refinery in Nicetown, or PGW’s new liquid natural gas processing plant in South Philadelphia, are continuing the legacy of Philadelphia’s placement of refining and polluting industries in low-income and disinvested areas (Bates, 2018). These geographic locations have both short-term and long-term impacts upon the health of the residents in direct proximity to them. In this paper, the temporal analysis of the daily Air Quality Index will determine if there are days in Philadelphia in which the Air Quality Index is higher than expected, based upon the data available from six air quality monitors in 2017.
Literature review
From local and state statistics, the prevalence of asthma among school children has been widely demonstrated. As the research came together about air quality and its impacts, especially in urban areas, a primary linkage that is only beginning to be established is that of asthma-related school absences and children’s health and education outcomes. One of the immediate impacts of asthma is that the complications from the chronic health condition result in a high number of absences from school (Zahran et al. 2018). A lack of continuity and consistency in children’s education can have adverse impacts not only on their school outcomes, but on their overall wellness. How asthma in particular affects those health outcomes is not directly correlated in the studies presented here, but there is a lot of evidence to suggest that those factors share a common thread.
First, looking at the research around absenteeism, there are links between absenteeism in the first month of the school year predicting higher rates throughout the school year. When the number of days absent in the first month increases from 2 days to over 4 days, the average days absent per month in the rest of the school year increases from an average of 2 days per month, up to 6-9 days per month (Olson, 2014). In another study, rates of absenteeism were linked to lower standardized test results, taking into consideration other factors that affect students’ academic performance (Garcia and Weiss, 2018). For the earliest grades, a study performed on behalf of AttendanceWorks in San Francisco focused on attendance and performance of students from Santa Clara and San Mateo Counties. The attendance of these students was tracked from kindergarten through third grade, as well as their performance on the English Language Arts (ELA) and Mathematics California Standards Tests (CSTs). For the group of students that were chronically absent (10% or more days absent), only 17% tested at grade level on the ELA. The group that was absent for 0-4% of school days tested at grade level at a rate of 64% on the CST, a difference that was statistically significant (ASR, 2011).
Turning our attention to the statistics on asthma, particularly in school children, there are significant health risks in the Philadelphia region to children’s respiratory wellness. The greater Philadelphia are ranked in the top 25 worst cities for ozone and yearly particle pollution according to data gathered from 2015-2017. According to the State of the Air report released by the American Lung Association (ALA), Philadelphia’s high levels of pollution expose 1,575,227 residents under the age of 18 to air pollution, including approximately 136,258 cases of pediatric asthma (ALA, 2019). In a statewide study from the Pennsylvania Department of Health, the rate of school students with asthma increased from 11.8% in 2003-2004 to 16.9% in 2008-2009 (PA Dept. of Health, 2012).
In a recent meta-analysis of previous studies on asthma and exposure to air pollution, there was a conclusion of certain risk estimates having statistically significant relationships with black carbon (BC), nitrogen dioxide (NO2), and particulate matter (PM2.5 and PM10) (Khreis et al, 2017). Although more study is required, these findings reinforce the hypothesis that traffic-related air pollution is a significant contributing factor to the development of childhood asthma. One source of this pollution that literally brings the issue to the schoolyard is the fleet of approximately 1,500 diesel school busses that the School District of Philadelphia uses to transport students to school each day. The environmental group PennEnvironment, with the support of the director of environmental science from the Philadelphia Federation of Teachers’ Union (PFT), are spearheading a call for the School District and SEPTA to move towards 100% electric vehicles (Newhouse, 2018). Although the number of asthma-related hospitalizations per 10,000 children declined from 98.8 per 10,000 in 2011 to 58.8 per 10,000 in 2016, the hospitalization rates for children in further West Philadelphia and upper North Philadelphia were still the highest in the city, and were 5 to 6 times higher among non-hispanic black and hispanic children than among non-hispanic white children (Dept. of Public Health, 2018). These significant disparities in asthma rates among the city’s population deserve a greater level of awareness from the city’s policymakers and health officials.
Methods
For the analysis in this paper, the data originated from the system developed the U.S. Environmental Protection Agency (EPA) and other organizations to provide easy access to air quality information to the public. This data is gathered and published at AirNow.gov, which provides up to local daily Air Quality Index (AQI) statuses. The Air Quality Index was developed by the EPA to measure air pollutants regulated by the Clean Air Act. There are five pollutants which factor into the AQI: ground-level ozone, particle pollution (also known as particulate matter), carbon monoxide, sulfur dioxide, and nitrogen dioxide (AirNow, 2016). The Air Quality Index rates the quality of the air on a scale from 0-500. A rating below 50 is considered good quality, below 100 is moderate, and anything over 100 is unhealthy (see figure 1.0) (AirNow, 2016).
In Philadelphia, the EPA monitors the air quality at six different locations (see figure 2.0). These monitors generate different reports, some hourly and daily, others only daily. The average AQI is reported for each location for most days out of the year, although some monitors do have gaps in reporting. The number of days in 2017 with reported AQI, also referred to here as the number of cases, ranged between 185 and 315 days. In order to visually compare the data in a scatterplot chart, the data had to have spaces inserted for every day on which an observation was not recorded.
Since the data being analyzed is time-based and spatially fixed, a normal temporal scan statistic was used to search for high and low clusters. Scan statistics can be used to find and analyze clusters of “events” within the context of a temporal, spatial, or time-space environment. In the case of a temporal analysis, the scan is looking to see whether the events are scattered randomly through time, or if they are clustered together. The null hypothesis is that during a year of testing, the air quality index level is random and does not have significant clusters of higher or lower than expected values within a set window of time. Using the SaTScan software, the settings were chosen for a purely temporal analysis with the maximum temporal cluster size set at 5% of the study period, or approximately 18.25 days. A normal probability model was used, with a time aggregation of the scan set at 3 days. These settings were used to scan each individual monitor.
Results
The scan of each monitor resulted in one cluster, with five out of six of those clusters displaying values higher than expected (see figure 3.0). The cluster that had lower than expected values and four of the five high value clusters were statistically significant. The monitor at Site 4 that did not reach statistical significance had far fewer cases – 185 cases, compared to the next lowest at 258 cases – which may have affected the ability to reach a statistically significant result. Three of the four significantly high clusters fell during cooler times of the year. Site 55 had a significant cluster in June, Site 48 had a significant cluster in November, and Sites 75 and 76 both had significant clusters in December.
Considering that ozone levels tend to rise in summer, it seems somewhat counter-intuitive that the significant high clusters almost all fall during the winter months. In relation to the student population at risk, it is relevant that all of the significant clusters happened during the school year in Philadelphia. With further investigation or more data, this could potentially be analyzed alongside days of high school absence. Although the factors are not known, with more research it would be interesting to see if the timing during fall and winter is a consistent pattern, and if so, if the air quality might be linked more strongly to other events such as heavier traffic, local weather patterns, or negative air quality events such as fires or unmonitored emissions.
Limitations
Some of the limits to running a temporal scan statistic is that the only factor being analyzed is events in time, but not the spatial surroundings of those events. A different set of data would be required to look at air quality in relation to asthma cases or asthma-related school absences, for example. Additionally, the limited number of air quality monitors only picks up data from isolated points in the city of Philadelphia. There are other air quality monitors in the city that are picking up data, such as those associated with the organization Purple Air, through which anyone can purchase an air quality monitor and connect it to the internet for the data to be collected and mapped (PurpleAir, 2017). However, those monitors only measure particulate matter (PM2.5 and PM10), and don’t include other pollutants such as ozone or nitrous dioxide. If there were more monitors picking up a consistent type of data, more differentiation between which neighborhoods have a higher or lower risk of exposure could be determined.
With the dataset of one year of Air Quality Index ratings, it is difficult to assess the more long-term trends in air quality. With the scan statistic, the measurement is comparing to the other values already occurring in the study area, and so if the baseline is already skewed, there isn’t a way to determine whether the values present now are abnormal compared to history. Analyzing more years of data would be possible, but unwieldy to process and present the data for such a large temporal study area.
Another limitation is that the data available from the EPA monitors provides the Air Quality Index measurement, and not the particular levels of each type of pollutant. That makes it more difficult to determine the cause of the spikes in AQI, or to research deeper into a particular factor such as traffic pollution or refinery emissions. With research leading to particular types of air pollution being a likely cause for the onset of asthma in children, it seems crucial to know what children are being exposed to and where.
Conclusion
In the overview of 2017 Air Quality Index data, the trends all seem to point to higher levels of air pollution in the cooler months of the year, with the lowest points occurring during the months from May-July (see Figure 5.0). This leads to more questions about what the immediate concerns for the residents of Philadelphia might be, and how those problems may be addressed. As the American Lung Association details in their report, climate change is a factor in decreasing air quality. As temperatures rise, the number of days with high ozone levels and high particulate matter increased at an alarming rate (ALA, 2019). In Philadelphia, since the days where AQI peaked at the highest risk levels fell during cooler months, it is possible that climate change has already affected the base level AQI levels to a point where the high ozone days are happening throughout more of the year, not just during the summer. Those days, when compounded by other factors such as traffic or other chemical emissions, could then result in especially high-risk times during times of the year when one would normally not expect it.
At the local level, there are several risk factors that might not even register at the level of city recognition, or be looked over because they occur in low-income and minority neighborhoods. Polluting sources abound in these neighborhoods, such as scrapyards which often burn toxic materials illegally or that catch fire for other reasons, bus depots where diesel vehicles idle regularly, and unregulated building projects that stir up lead and other heavy metals in the soil. Residents often have complained about these companies, which may be slapped with a fine or violation, only to pay or make the appearance of changes, and go back to business within a few days (Beck, 2018). This can continue for many years while residents are exposed to pollutants that contribute to various respiratory diseases and chronic illnesses.
In order to comprehensively establish awareness of the air quality in Philadelphia, more monitors that can provide a denser spatial network of data points is essential. Alerts and warnings should be available to the surrounding neighbors anytime the air quality goes over safe levels, as well as information about what precautions to take if they must be outside. Most of all, the long-term preventative measures need to be taken to improve air quality, and alongside investing resources in helping residents to cope with asthma and other respiratory illness. Low emission energy sources should be prioritized, both for the greater climate change concern and for the neighbors that live in close proximity to the energy sources.
Long-term data analysis and comparison should also be compiled in order to understand the greater trends over time, and not keep the baseline goal at a level that actually allows pollution to continue in the city unchecked. Local government involvement in the communities at risk is necessary for solving the complex network of factors that contributes to poor air quality. With the cooperation between health, environmental, and education departments, there could be holistic methods developed to understand how air quality, asthma, and health are crucially connected. At that intersection of multiple methods and approaches, the potential for healthy air quality can be found.
Charts
Figure 1.0: Air Quality Index Values (AirNow, 2016):
| Air Quality Index (AQI) Values | Levels of Health Concern | Colors |
| When the AQI is in this range: | ..air quality conditions are: | …as symbolized by this color: |
| 0 to 50 | Good | Green |
| 51 to 100 | Moderate | Yellow |
| 101 to 150 | Unhealthy for Sensitive Groups | Orange |
| 151 to 200 | Unhealthy | Red |
| 201 to 300 | Very Unhealthy | Purple |
| 301 to 500 | Hazardous | Maroon |
Figure 2.0: Air Quality Monitors in Philadelphia

Figure 3.0: Summary of Temporal Scan Statistic Results:
| Site ID | Total # of cases | Cluster Date Begin | Cluster Date End | # of cases | Mean Inside Cluster | Mean Outside Cluster | Standard Deviation | P-value | Stat. Signif. | High or low cluster |
| 4 | 185 | 11/11/17 | 11/13/17 | 2 | 73 | 32.17 | 14.28 | 0.041 | no | High |
| 48 | 315 | 11/11/17 | 11/28/17 | 15 | 56.33 | 34.8 | 16.79 | 0.001 | yes | High |
| 55 | 296 | 6/11/17 | 6/25/17 | 14 | 58.71 | 39.56 | 14.07 | 0.001 | yes | High |
| 57 | 309 | 4/30/17 | 5/14/17 | 13 | 24.23 | 41.03 | 13.9 | 0.009 | yes | Low |
| 75 | 310 | 12/14/17 | 12/31/17 | 17 | 57.88 | 31.76 | 17.33 | 0.001 | yes | High |
| 76 | 258 | 12/2/17 | 12/19/17 | 18 | 55 | 32.77 | 15.28 | 0.001 | yes | High |
Figure 4.0: Scatter Plot of AQI monitor results

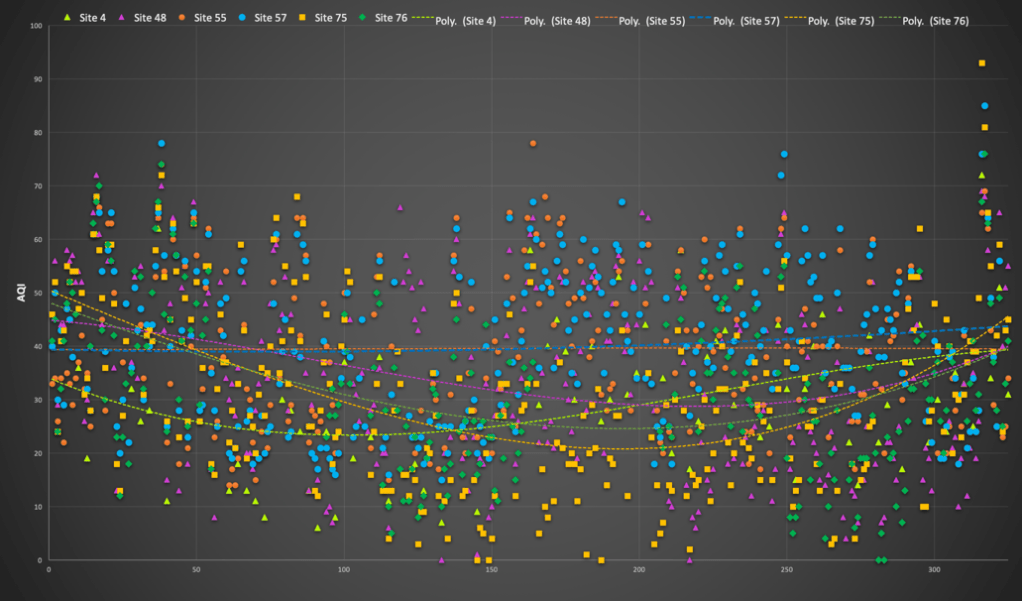
Figure 5.0: AQI Distribution with Third-degree Polynomial Trendlines
References
AirNow (2016). Air Quality Index (AQI) Basics. U.S. Environmental Protection Agency. Retrieved from: https://www.airnow.gov/index.cfm?action=aqibasics.aqi
American Lung Association (ALA) (2019). State of the Air® 2019. Chicago, IL. Retrieved from: https://www.lung.org/assets/documents/healthy-air/state-of-the-air/sota-2019-full.pdf
Applied Survey Research (ASR). (2011). Attendance in Early Elementary Grades Associations with Student Characteristics, School Readiness, and Third Grade Outcomes. https://www.attendanceworks.org/wp-content/uploads/2017/06/ASR-Mini-Report-Attendance-Readiness-and-Third-Grade-Outcomes-7-8-11.pdf
Bate, D. (2018). PGW plan for liquified natural gas facility in Southwest Philadelphia clears hurdle. WHYY. Philadelphia, PA. Retrieved from: https://whyy.org/articles/pgw-plan-for-liquified-natural-gas-facility-in-southwest-philadelphia-clears-hurdle/
Beck, T. (2018). City Licenses and Inspections forces scrapyard that caught fire to shut down again. Star News Philly. Retrieved from: https://starnewsphilly.com/city-licenses-and-inspections-forces-scrapyard-that-caught-fire-to-shut-down-again-ed62e3115b71
Department of Public Health (2018). Health of the City 2018. City of Philadelphia. Retrieved from: https://www.phila.gov/media/20181220135006/Health-of-the-City-2018.pdf
Environmental Protection Agency (2018) Air Data: Pre-Generated Data Files. https://aqs.epa.gov/aqsweb/airdata/download_files.html
Jaramillo, C. (2018) Mixed reviews for a proposed $120M renewable-energy plant at South Philly refinery. WHYY. Philadelphia, PA. Retrieved from: https://whyy.org/articles/mixed-reviews-for-a-proposed-120m-renewable-energy-plant-at-south-philly-refinery/
Jaramillo, C (2018). Philadelphia Energy Solutions: A giant polluter looms over the lives — and health — of its neighbors. State Impact Pennsylvania. Retrieved from: https://stateimpact.npr.org/pennsylvania/2018/02/20/philadelphia-energy-solutions-a-giant-polluter-looms-over-the-lives-and-health-of-its-neighbors/
Khreis et al. (2017) Exposure to traffic-related air pollution and risk of development of childhood asthma: A systematic review and meta-analysis, Environment International, Volume 100, 2017, Pages 1-31, ISSN 0160-4120, https://doi.org/10.1016/j.envint.2016.11.012. (http://www.sciencedirect.com/science/article/pii/S0160412016307838)
Garcia and Weiss. (2018) Student absenteeism: Who misses school and how missing school matters for performance. Economic Policy Institute. https://www.epi.org/publication/student-absenteeism-who-misses-school-and-how-missing-school-matters-for-performance/
Newhouse, S. (2018). Philly needs more electric buses, environmental group says. https://www.metro.us/news/local-news/philadelphia/philly-needs-more-electric-buses-environmental-group-says
Olson, L. (2014) Why September Matters: Improving Student Attendance. Baltimore Education Research Consortium (BERC). Baltimore, MD. Retrieved from: http://baltimore-berc.org/wp-content/uploads/2014/08/SeptemberAttendanceBriefJuly2014.pdf
Pennsylvania Department of Health (2012) 2012 Pennsylvania Asthma Burden Report. Retrieved from: http://www.paasthma.org/images/docs/2012_asthma_burden_report.pdf
PurpleAir (2017). Frequently Asked Questions. Retrieved from: https://www.purpleair.com/faq
Zahran et al. (2018) Vital Signs: Asthma in Children — United States, 2001–2016. MMWR Morb Mortal Wkly Rep 2018; 67:149–155. DOI: http://dx.doi.org/10.15585/mmwr.mm6705e1

You must be logged in to post a comment.