
In this analysis, I am building upon information which demonstrates that Philadelphia has the highest rate of asthma among school children in the state of Pennsylvania. There are studies which have linked childhood asthma with exposure to diesel and PM 2.5 (atmospheric particulate matter) emissions. Other studies have shown how children with frequent absences from school experience a critically diminished educational achievement. There is limited information about the rate at which children in specific schools are absent because of asthma. While some of this may be due to the privacy of health records, there is a gap in recording the number of asthma cases and the type of absences per school. While many resources exist about managing asthma and helping students, parents, and teachers understand the health implications, there is a disconnect between living with the disease and the environmental factors that are causing it.
This report is looking at the current absence rates at Philadelphia schools, along with the environmental factors which exist in their areas. While the environment in which a child’s school is located would not be the only contributing factor to their health outcome, it does play a major role in their life. While acknowledging that other factors such as the home environment, smoking, and other environmental contaminants may contribute to a child developing asthma, I am looking specifically at the school environment, because of the amount of time that a child will spend there, as well as the demonstrated effects that having an asthma-related health emergency during school can have on a child’s educational well-being.
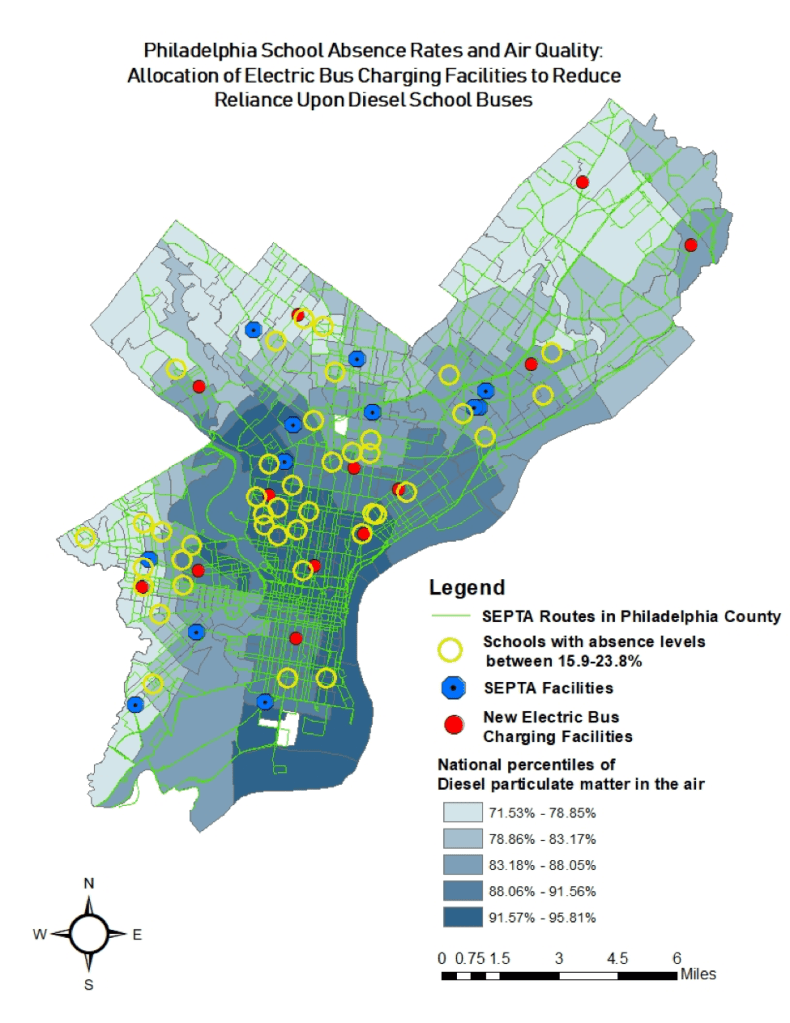
I am analyzing the logistics necessary to improve the air quality around schools by transitioning to electric buses, both for public transit and for school buses. One of the current barriers to expanding the fleet of electric buses is a lack of space for charging stations. The analysis here proposes that in addition to converting the current bus/transit depots into charging stations – something which I hope is to come in the future – there are other potential sites that could be used for charging buses along their routes. Specifically, this analysis looks for bus charging stations that could also be used by electric school buses, that are in close proximity to schools with high absence rates, in order to target those areas first in the conversion from diesel school buses to electric school buses. These charging stations could be utilized by public transit buses or local residents in the evenings, and by electric school buses during the school day.
Methods:
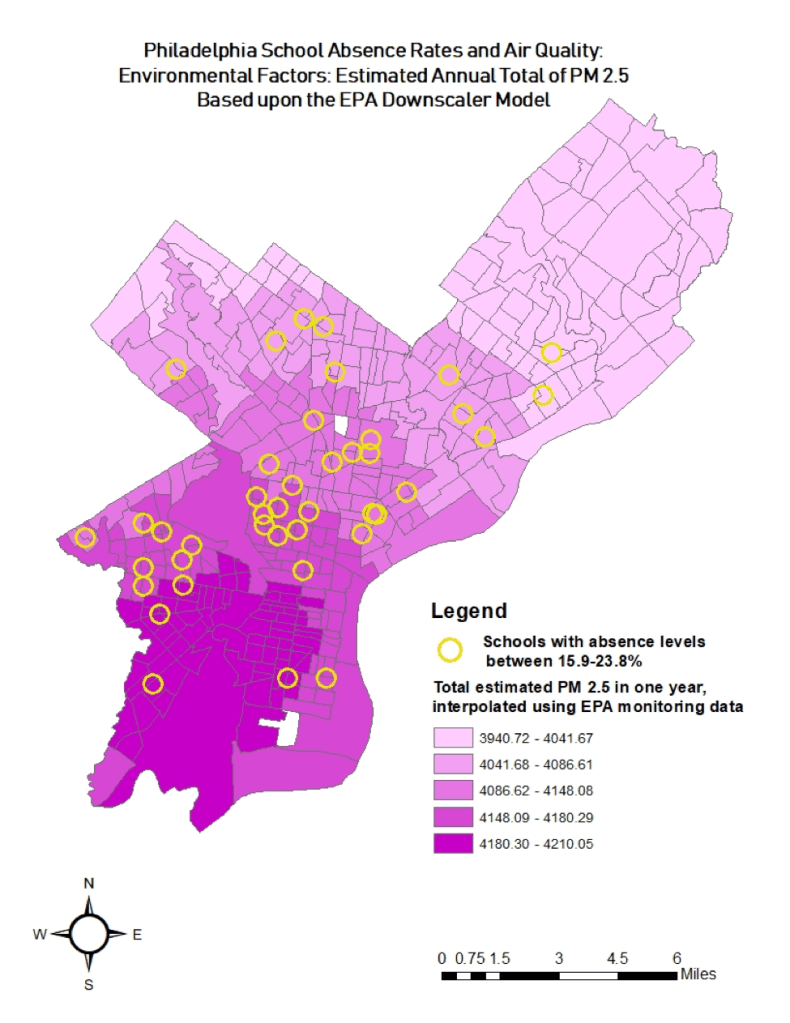
The demographic information that is mapped here came from the Census Bureau, with data organized by census tract. This specifically looks at the number of children ages 5-17 that are living in poverty. The environmental factors are derived from the EPA in two different formats. There is the interpolated PM 2.5 emissions data using their Downscaler Model, which I have mapped based upon the total emissions for the year for each census tract. This data, while helpful in that it is broken down by census tract, has been smoothed as a result of the interpolation, which averages values based on their distance from actual points of measurement. Therefore it doesn’t indicate extreme differences between geographic areas. However, the other information gathered from the EPA’s EJ Screen (EPA’s Environmental Justice Screening and Mapping Tool) does give a more detailed picture of the concentrations of diesel particulate matter, air toxics respiratory hazard, and proximity to heavy traffic.
The school attendance data is retrieved from the School District’s partnership with Open Data Philly. This data is joined with the Schools shapefile found directly on Open Data Philly, and then the absence rate is calculated by using the attendance rate subtracted from 100%. The absence rate is then calculated in five quantiles, and each quantile assigned a rating, from 1 being the lowest absence rate, to 5 being the highest.
For the current locations of SEPTA’s maintenance facilities, a list of locations was compiled, addresses found, and then this data was geocoded using the Philadelphia Streets Centerlines file. Not all of the locations are currently functioning facilities, but since they are still listed by SEPTA, it is assumed they currently own the property and could still use these locations in the future as electric bus charging sites.
The additional bus charging sites were extracted from the Philly Land Use raster dataset. This raster data was exported into a shapefile, and all the paved-non-road areas were further selected out of that data. These areas were converted using the Multipart to Singlepart tool, which takes a single polygon comprised of many different sections and converts each uninterrupted section into a separate polygon. This list of polygons then has their areas calculated in square meters. Based upon the size of a few of the SEPTA facilities, as well as the goal that these areas could be easily found among areas that are otherwise densely residential, the paved areas were selected by attribute for spaces that are between 10,000 and 30,000 square meters. These spaces were then selected by location within 100 meters of a school, and that selection of areas was transformed using Feature to Point, in order to be used by the Location-Allocation tool.
The SEPTA transit network was transformed into a network dataset. This allowed for a network analysis function to be performed based upon where the transit lines already are running. The Location-Allocation tool assists in determining which facility locations (electric bus charging stations) would best serve the demand locations (schools) at the lowest cost. Using distance as the cost, weighted by the absence rate, Location-Allocation determines which facilities are located at the shortest distance to the points (schools) which could most benefit from improved air quality. The original SEPTA facilities were loaded as required facilities. The new possible bus charging locations were added as candidates. A total of 22 facilities were requested, including the original 12 SEPTA facilities and an additional 10 new locations. These 10 new locations were chosen by the Location-Allocation tool from the candidates and the combined result was exported as a new set of points.
SEPTA Transit Depots
| Name | Address | City | State | ZipCode |
| Allegheny Depot | 2500 W Allegheny Ave | Philadelphia | PA | 19132 |
| Berridge Shops | 200 W Wyoming Ave | Philadelphia | PA | 19140 |
| Bridge Street Yard | 1500 Bridge St | Philadelphia | PA | 19124 |
| Callowhill Depot | 350 N 58th St | Philadelphia | PA | 19131 |
| Comly Depot | 6000 Penn St | Philadelphia | PA | 19149 |
| Elmwood Depot | 7311 W Elmwood Avenue | Philadelphia | PA | 19142 |
| Fern Rock Yard | 900 Nedro Avenue | Philadelphia | PA | 19141 |
| Frankford Depot | 5235 Penn St | Philadelphia | PA | 19124 |
| Germantown Brakes Maintenance Facility | 6725 Germantown Ave | Philadelphia | PA | 19119 |
| Midvale Depot | 2401 Roberts Ave | Philadelphia | PA | 19144 |
| Southern Depot | 2901 S 19th St | Philadelphia | PA | 19145 |
| Woodland Maintenance Facility | 4901 Woodland Ave | Philadelphia | PA | 19143 |


Results:
The new locations were mostly located within the north/northeast Philadelphia area, in areas with schools that have higher absence rates. Of the three environmental factors, it appears that the schools with high absence rates are located primarily in areas that are also in the highest percentile of diesel particulate matter. Of the various factors, it appears that children living in poverty, diesel particulate matter, and respiratory hazards all coincide in the same area of North Philadelphia. This would be a fitting area to begin the move from diesel to electric, for both public transit as well as school buses.
Heavy traffic proximity was less of a factor than I had initially thought it would be. While roads that carry heavy traffic clearly contribute to the poor air quality, there are other contributors to air pollution that unfortunately even out the particulate matter exposure over a wider area. Another surprise in the results is that Southwest Philadelphia doesn’t have as many schools located there as I assumed it would. This may simply be an areal unit problem, in that many schools affected by air pollution in that area may be located just over the line in Upper Darby and other neighboring towns. Either way, with the low count of schools in that area, and the location of two SEPTA facilities in the vicinity, there wasn’t much need for additional bus charging stations to be allocated there.
Conclusion:
To deepen the statistical analysis, I would join the schools with the local demographic and environmental factors for the census tracts in which they are located, and then look at the breakdown of those factors by each level of absence rate. The limitation to this analysis is that some schools draw in children from other areas and therefore the population of the school may not accurately reflect that of the census tract in which it is located. Thus some schools in less polluted census tracts may have students who are exposed to more factors of air pollution at home, or vice versa. As I addressed at the beginning, the contributing factors to childhood asthma often begin in the environment in which their home is located. However, I expect that environmental factors in and around schools heavily influence children during their learning experience.
Further data and exploration is needed to connect the dots from air quality to school absences, in the context of childhood asthma. While the information presented here is not able to make that connection directly, we cannot ignore the fact that children in the city are exposed every day to high rates of air pollution. There needs to be substantial investment in transforming the transit networks in this city to rely on sustainable modes of energy. It particularly does not make sense to place a new natural gas processing plant in the same area of North Philadelphia that is already exposed to high levels of toxins and particulate matter. By adding electric bus charging infrastructure to the existing SEPTA depots, the network will already be strengthened. Supplementing that infrastructure with additional sites which could be used by SEPTA, private school bus companies, delivery trucks, and local residents would increase the resilience and reliability of the electric vehicle network.
References:
https://www.sciencedirect.com/science/article/pii/S0160412016307838
https://www.jacionline.org/article/S0091-6749(18)30143-X/pdf
State Asthma Report
https://www.health.pa.gov/topics/programs/Asthma/Pages/Surveillance-Reports.aspx
https://www.aafa.org/managing-asthma-in-school/
https://www.cdc.gov/asthma/asthmadata.htm
https://www.epa.gov/air-research/downscaler-model-predicting-daily-air-pollution

You must be logged in to post a comment.